Scroll To Top

agpa k-12 outreach banner

Lesson Plans

Return to Lesson Plan Index
Printer Friendly Version

How Creepy!

Grades: 5-8
Author: Tess Ewart
Source: Adapted from PALS - http://pals.sri.com/tasks/5-8/Creeping/


Abstract

Students will observe, measure, and graph a model of slow downslope movement. This task assesses students' abilities to collect, record, and organize data, set up graph axes, plot data points, draw line graphs, apply mathematics, infer based on observational data, predict based on a model, and apply models to other situations.


Objectives

What should students know as a result of this lesson?

  • Students should be able to describe mass wasting and what elements are needed for a good graphical representation of data.

What should the students be able to do as a result of this lesson?

  • Students should be able to observe, measure, and make a line graph of a model of slow downslope movement.
  • Students should be able to infer based on observational data, predict based on a model, and apply models to other situations.

Materials

The materials the presenter will need depend on the "creeping material" chosen. See Advance Preparation.

For Glop, the teacher will need:

  • Borax
  • Water
  • Food Coloring
  • White glue
  • Bucket
  • Stirring stick
  • Sealing plastic bag for storage

For Oobleck, the teacher will need:

  • Corn starch
  • Water
  • Bucket
  • Stirring spoon

Or you can use commercially bought Slime for this experiment.

At each station, students should have the following:

  • Beaker for "creeping material"
  • 125 ml of "creeping material"
  • Transparency of a metric ruler
  • Clipboard or student tray
  • Notecard
  • Timer
  • Tape
  • Blocks
  • Calculator (optional)

Procedures

Engagement

Show an image of a mountain range or a fault line. One that can be found at the following web sites:

Ask the students: "How fast are the mountains moving? How fast are Earth's tectonic plates moving? (most can be measured in centimeters per year) How do you know? How do scientists know?" (accept all answers - scientists can use sensors to take detailed measurements)

Tell the students that, "Scientists have to keep accurate data over time. They usually represent this data in graphs to convey their ideas to other people. Why is it important for students to be able to read graphs effectively?" (Being able to read graphs effectively can improve students' scientific literacy) The best way to work on this skill is to have students construct graphs of their own.

Discuss with the students why it is important to have experiments repeated several times. (Repeating experiments several times ensures the validity of the results and conclusions)

Tell the students that "scientists also represent their ideas using models." Students will now use a model to represent a type of slow mass wasting called creep.

Assessment: Student discussion

Exploration

How Creepy! Measuring creep/flow

  1. Set up the equipment exactly as it appears in the Picture Above. Specify 3 heights - determined by what is used to elevate the clipboard. Use the tape to hold the beaker in the correct location. ** The creeping material must flow down the metric scale on the ruler. **
  2. Turn the clipboard so the beaker is upright. Add creeping material to the beaker. Cover the beaker to hold the creeping material in when replacing the clipboard on the prop.
  3. Uncover the beaker and start the stop watch when the creeping material flows across the 0 cm line on the ruler.
  4. While the creeping material is moving down the board, take readings every half minute for a maximum of 10 minutes.
  5. Read, to the nearest tenth of a centimeter, the location of the front of the creeping material on the metric scale. Record your observations on the data table.
  6. After completing the readings, remove the clipboard and set it so the beaker is upright. Peel the creeping material from the plastic sheet, return it to the beaker, and cover the beaker.
  7. Adjust the clipboard to the next height. Repeat procedures.

Assessment: Completed student answer sheets

Explanation

Ask the students, "What type of graph would be best to use for the data you just created? Why?" (A line graph would be best because it shows movement over time of the material.)

Have the students create a graph for their data giving little guidance. When finished, have the students share the graphs they created. Ask the students, "What is similar about the graphs? What is different?" (accept all answers) "What makes a good graph?" (Every graph should contain the following elements: a title, labeled axes with the appropriate units in parentheses, axes that start at the origin (0,0), numbered axes in regular intervals (but it does not have to go by ones and the two axes do not have to increase by the same interval), and provide a key if you have more than one line.) The Dalton School: Graphing Guidelines - http://intranet.dalton.org/departments/Science/Biology1/graph_guidelines.html

Tell the students, "Sometimes, scientists use models to convey their ideas to people. These models have their limitations and do not totally represent what is occurring in real life. For example, a candy bar can be used to illustrate the movement of tectonic plates on Earth's asthenosphere. The movement of the 'tectonic plates' in the candy bar is made by the person holding the bar while the motion of the tectonic plates in Earth is due to the convection currents within the asthenosphere." The limitations of models should be discussed with students.

Assessment: Completed graphs and discussion

Elaboration

Ask the students, "What do the graphs show about creep? (As the angle of repose (height of the board) increases, the material should flow faster.) What does this mean for hill sides? (The steeper the hill side, the more likely material will flow, the faster it will flow.) What would be some real life situations where creep would be an issue?" (accept all answers)

Make sure you stress to students that while each group is doing one trial at different elevations, by having the whole class do the same three elevations, this would constitute repeated trials.

Have students predict what would happen to the graph if the viscosity (thickness) of the material changes. Have students predict what would happen to toothpicks that are placed in a straight line across the material. Students should give their reasons behind their ideas. If enough time, have students explore their ideas.

Assessment: Application of model to real life situations, graph predictions


Prerequisites

1. Make "Creeping Material"

  • Recipe for "Glop"
    • Dissolve 75 ml cup Borax in one liter of water and set aside (1:16 ratio).
    • Mix equal parts of white glue and water.
    • Add several drops food coloring to the glue mixture.
    • Measure 50 ml of borax solution and place in a sealing plastic bag.
    • Measure 150 ml of the glue mixture and place in a sealing plastic bag.
    • Just before using, combine the glue mixture and the Borax mixture, in a 3:1 ratio, seal the bag again and knead to form "glop".
      • Mix until the glop has the consistency of silly putty.
      • A more concentrated solution of borax will give you a stiffer mixture.
      • Store the glop in the sealing bags.
      • Refrigerate in sealed plastic bags for long-term storage.
    • ***Do not use the fluorescent Elmer's Glue. It is not always successful.
    • "Glop" may be mixed and stored in any sealable container.
  • Recipe for "Oobleck" - Materials: Cornstarch and Water
    • Pour the water into a cup.
    • Add cornstarch a little at a time while stirring.
    • Keep adding more water or cornstarch until the Oobleck reaches the desired consistency.

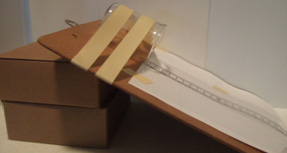
2. Exploration materials setup for each lab station:

  • Make a transparency of a metric ruler for each lab setup used. Make sure the metric ruler is in the center of the transparency sheet. It may be best to copy the metric ruler leaving a bit of space above the 0 cm mark for the beaker location.
  • Tape the transparency to the back of the clipboard. To make observations easier to make, place a piece of white paper underneath the transparency.
  • Rest the clipboard on a pile of wood blocks or other supporting material. The clip end should be resting on the blocks.
  • Place the creeping material into a beaker. Cover the top of the beaker to keep the creeping material inside until the exploration begins.

Use masking tape to keep the beaker steady on the clipboard by taping across the beaker onto the clipboard. The lip of the beaker should be on the tape at the 0 cm mark of the transparency.


Best Teaching Practices

  • Inquiry
  • Simulation
  • Use of Models

Alignment with Standards

NGSS Standards:

  • MS-ESS2-1 Develop a model to describe the cycling of Earth's materials and the flow of energy that drives this process.
  • MS-ESS2-2 Construct an explanation based on evidence for how geoscience processes have changed Earth's surface at varying time and spatial scales.
  • MS-PS1-2 Analyze and interpret data on the properties of substances before and after the substances interact to determine if a chemical reaction has occurred.
  • MS-PS2-2 Plan an investigation to provide evidence that the change in an object's motion depends on the sum of the forces on the object and the mass of the object.

Common Core Standards:

  • RST.6-8.1 Cite specific textual evidence to support analysis of science and technical texts.
  • RST.6-8.3 Follow preciesly a multistep procedure when carrying our experiments, taking measurements, or performing technical tasks.
  • WHST.6-8.2 Write informative/explanatory texts, including the narration of historical events, scientific procedures/experiments, or technical processes.

National Standards:

  • 8 ASI 1: Scientific Inquiry 1.4 and 1.8
  • 8 D ESS 1: Structure of the earth system 1.3

Ohio Standards:

  • Scientific Ways of Knowing Grades 6-8 Benchmark A
  • Earth and Space Sciences Grades 6-8 Benchmark E

Content Knowledge

Mass wasting is the name for all of the Earth processes by which gravity pulls materials down. Some of the processes, like landslides and avalanches, are rapid, while others, like soil creeping, occur so slowly that observations are difficult to obtain.


Safety

  • The glop mixture contains Borax which is poisonous if ingested. If this material is accidentally eaten, call the poison control center immediately.
  • Borax is also an eye irritant. Eyes that may have been contaminated with glop should be flushed with water immediately. See Flinn Scientific website (www.flinnsci.org) for MSDS.
  • Students should be cautioned before task and instructed to wash their hands after completing the task.
  • Be careful.
  • Teachers and students should always exercise appropriate safety precautions and utilize appropriate laboratory safety procedures and equipment when working on science performance tasks.

Applications

Graphing can be applied to global warming, glacial movement, plate tectonics


Assessment

Have the students "solve" the problems illustrated by the graphs from the following web sites:


Other Considerations

Grouping Suggestions: Students should be ready to work as soon as the period begins. The materials should be set out at each lab station, if possible. A central supply area, if needed, should be easily accessible. All supplies should be clearly labeled.

Issues to consider are the following: seating so everyone can see the display and graphs, make sure every person participates in discussions and exploration, and grouping with diversity in mind.

Pacing/Suggested Time: One hour


Printable PDF Worksheets

Graphing Student Answer Sheet