
Raman Spectrometer
Rm 210 NPIC
Horiba LabRam HR Micro Raman Spectrometer
Renishaw InVia Reflex Micro Raman Spectrometer
Background
Raman Spectroscopy is a non-destructive analytical technique which provides detailed information about chemical structure, phase and polymorphism, crystallinity and molecular interactions. It is based upon the interaction of light with molecular or crystal lattice vibrations within a material.
Raman is a light scattering technique, in which molecular vibrations or collective excitations in solids (phonons) scatter incident light from a high intensity laser light source. Most of the scattered light is at the same frequency as the laser (elastic) and is called Rayleigh scattering. A small amount of light (typically 10-6 – 10-7 from the laser intensity) is scattered at different frequencies (inelastic scattering), which depend on the chemical structure of the studied material – this is called Raman Scattering.
When the laser light interacts with vibrations or phonons in the sample, the frequency of the laser photons is shifted up or down. This so called Raman shift in frequency gives information about the phonon or vibrational modes in the material. Thus a Raman spectrum features a number of peaks with shifted frequencies that exactly correspond to the frequencies of the molecular or phonon vibrations. These peaks can correspond to specific molecular bond vibrations, such as C-C, C=C, N-O, C-H, O-H etc, or/and groups of bonds such as benzene ring breathing mode, polymer chain vibrations, lattice modes etc.
In a Raman micro spectrometer the sample is illuminated with a laser beam through an objective of the integrated research grade optical microscope. Light from the focal spot is collected in back reflected mode with the same high quality microscope objective and sent through a spectrograph. Frequencies close to the laser line, due to elastic Rayleigh scattering, are filtered out while the rest of the collected light is dispersed onto a two dimensional detector (spectroscopic quality CCD).
Raman scattering is complementary to IR absorption and both techniques provide vibrational spectra in the range of wavenumbers up to 4000 cm-1. Raman offers several advantages over IR, including:
- Little or no sample preparation
- Ease in analyzing aqueous solutions
- High spatial and in-depth resolution due to employing visible and near IR lasers and confocal operation
- Raman peaks are narrower, and overtone and combination bands are weak
- Raman measures symmetric vibrations, which are week in the IR spectra
- Raman detection range reaches below 400 cm-1 (not possible with IR)
- Fundamental modes are measured, Raman bands can be easily related to chemical structure.
Applications
Nanomaterials, carbon materials, graphene, polymers, corrosion, pharmaceuticals, semiconductors, forensics, biology and medicine, environment and many others
Specifications
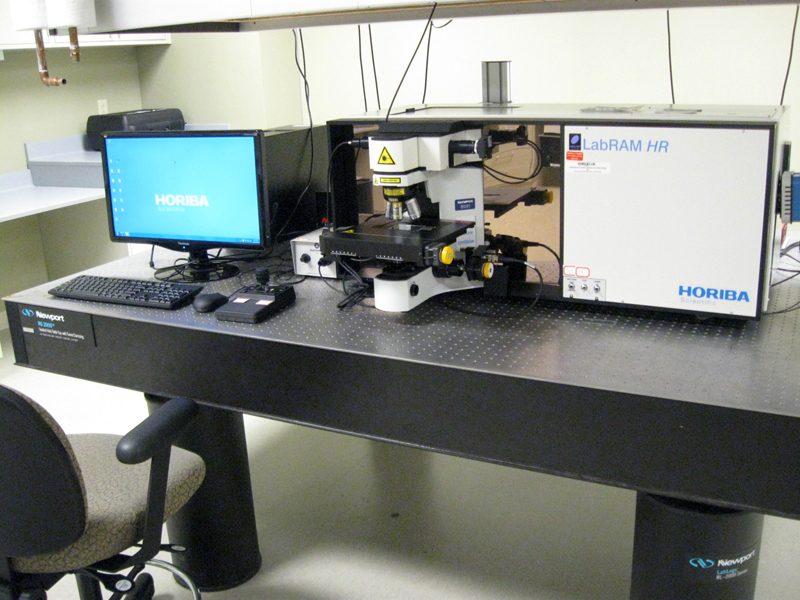
Horiba LabRam HR Micro Raman Spectrometer
- General
- High spatial and spectral resolutions
- High sensitivity for speed and improved limits of detection
- Full confocal performance– less than 2µm in depth resolution
- Confocal Raman imaging
- No sample preparation
- Non-destructive testing and analysis
- Lasers and optics
- Frequency doubled Nd:YAG laser (532 nm/ 60 mW), air-cooled
- Semiconductor diode laser (785 nm/ 100mW), air-cooled
- Laser focal spot diameter: < 1 μm
- Rayleigh cut off filters: edge filters allowing measurements above 100 cm-1
- Laser intensity control with ND filters: 50%, 25%, 10 %, 1%, 0.1%, 00.1% transmission
- Optics spectral range: 220 - 1600 nm
- Optical microscope: Olympus BX41
- Stage: motorized XYZ stage with PC and joystick control
- Scan area 75 × 50 mm (X × Y)
- Step size 0.1 μm
- Allows automated acquisition of Raman maps
- White light sources for reflected and transmitted light sample illumination
- High Definition USB video camera for sample visualization and laser spot alignment
- Microscope objectives (Olympus):
- 10x, NA = 0.25, WD = 10.6 mm
- 20x NA = 0.40, WD = 12 mm
- 50x, NA = 0.75, WD = 0.37 mm
- 100x, NA = 0.9, WD = 0.21 mm
- 100x IR, NA = 0.75, WD = 3.5 mm (Leica)
- Confocal coupling optics between microscope and spectrograph
- Adjustable confocal pinhole (0 – 100 μm), software controlled to define accurately the size of the analyzed volume
- Coupling optics to focus the Raman signal on the entrance slit of the spectrograph
- Axial confocal performance: < 2 μm (dependent on pinhole size)
- Spectrograph
- Focal length: 800 mm
- Gratings: 600 l/mm and 1200 l/mm (76 x 76 mm), mounted on a motorized turret, software controlled. Gratings can be interchanged without realignment
- Spectral resolution: 0.35 cm-1/pixel (at 633 nm with 1800 l/mm grating)
- Detector
- Type: Back thinned CCD, Chip size 26.6 x 6.7 mm
- Resolution: 1024x256 (pixel size 26x26 μm)
- Operating temperature: -70 °C (Peltier cooled)
- Spectral range: 200 - 1050 nm
- Quantum efficiency: > 30 % between 500 and 800 nm
- Typical read-out noise: 4 e- (rms)
- Dark noise: < 0.002 e-/(pixel⋅s)
- LabSpec 5 software for:
- Instrument control and data acquisition
- Data manipulation including Raman mapping and imaging
- Includes macro programming capabilities
Specifications
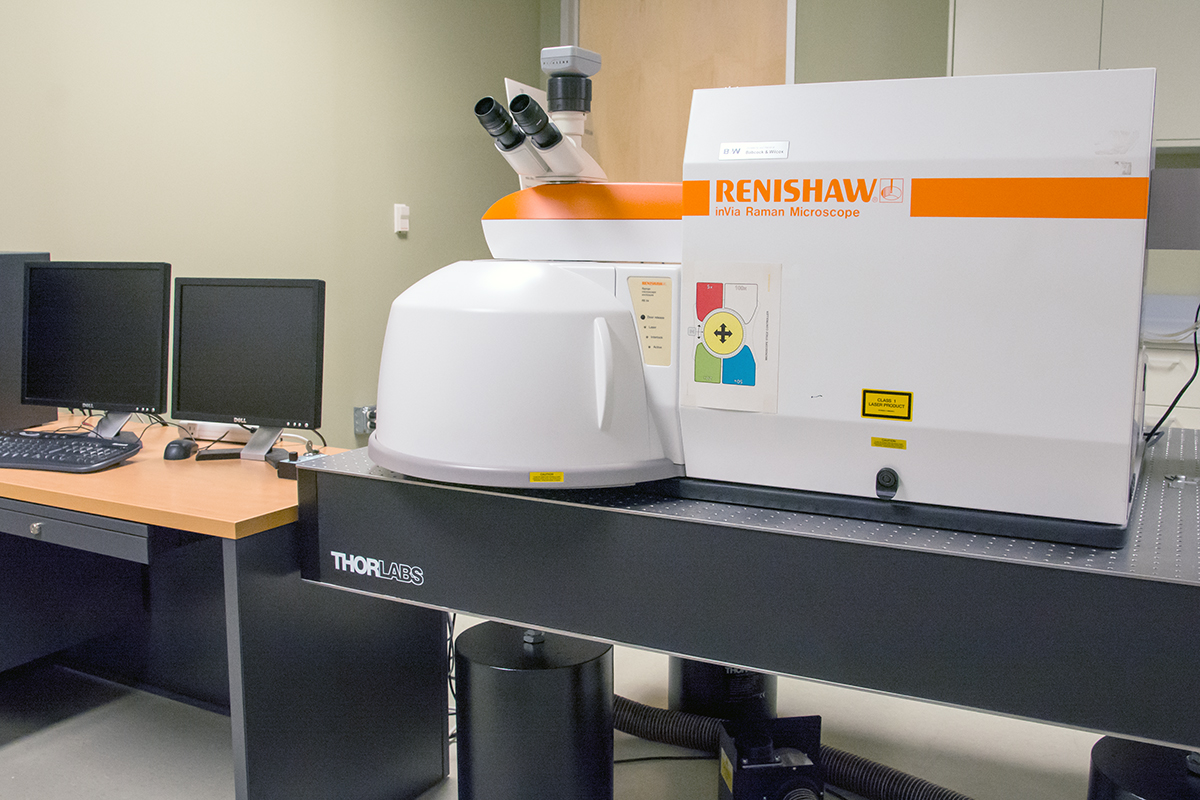
Renishaw InVia Raman Micro Spectrometer
- Spectrometer and Detector
- Extremely high efficiency 250 mm focal length spectrograph (>30% throughput in spectrograph)
- Laser spot size continuously variable from 1 to 300 µm (objective and excitation wavelength dependent)
- Unique continuously adjustable “easy confocal” facility utilizing software control CCD and motorized slit without the need for mechanical pinhole assembly
- Encoder feedback controlled grating stage with interchangeable magnetic, kinematic mount
- Unique extended scanning facility for measurement of high resolution spectra with wider wavelength range than can be accommodated on a single CCD exposure without any “stitching” of spectra together
- Spectral resolution continuously variable via CCD binning control
- UV enhanced, deep-depleted CCD array detector (1024 X 256 pixels), Peltier cooled; Detector range from 200 nm - 1100 nm; 2400 line/mm grating, 1 cm-1/pixel spectral dispersion @ 1000 cm-1 shift
- Motorized laser beam steering mirrors to allow for auto-align of laser spot to sample; Motorized neutral density filters offering 16 different power levels from 0.00005 to 100%.
- Spectrometer Automation
- Fully automated and self-validating Raman podule as part of the Raman microscope assembly with associated spectrometer hardware
- Auto align and optimization of input laser power; Auto switch and auto align of laser through pinhole of beam expander unit; Self-validation using built-in internal reference sample
- Built-in self-calibration and intensity correction using neon and white light sources; Motorized switching between laser and white light sample images using integral video
- Laser
- Multi-line Argon Ion laser, >25 mW at 514 nm, >25 mW at 488 nm, air cooled, with computer controlled plasma filter, for external mounting on laser baseplate
- Plasma line rejection filter for 488 nm or 514 nm excitation
- Rayleigh line rejection filters for 488 nm or 514 nm excitation, using paired filters, allowing for ripple-free measurement of the Raman spectrum to 100 cm-1 shift
- Microscope
- Specially adapted research grade Leica DM2500 M microscope allowing confocal Raman spectral measurements with better than 2.5 µm depth resolution (using 100x objective)
- Microscope objectives: NPLAN 5x/0.12, working distance = 13.2 mm; NPLAN 20x/0.40, working distance = 1.1 mm; NPLAN 50x/0.75, working distance = 0.37 mm; NPLAN LWD 50x/0.55, working distance = 8.2 mm; Microscope binocular interface with 10x eyepieces
- Software
- Renishaw WiRE 3.n instrument control and data acquisition software, fully integrated data analysis and presentation software with image capture software for white light image display and capture
- Spectral Library Search/Creation tool for WiRE; Thermo Galactic Spectral ID library search/creation utility; Renishaw Minerals and Inorganic Materials Raman Spectral Database (1000+ spectra); Renishaw Polymeric Materials Raman Spectral Database (Common Polymers/Organic Materials) (200+ spectra)